COVID-19 Case Prediction for the US up to March 22
Using data from the github repo that powers the JHU Covid-19 dashboard, I decided to try a few prediction exercises on expected number of COVID-19 cases in the US. An inspiration for the forecasts was a Reddit post comparing of Covid cases in Italy, US and California after setting them to a common starting baseline. I have included 2 additional countries - Iran and South Korea - and used the prophet package to make predictions.
Before getting into the prediction, it helps to compare what the cases look like by some of the countries with the highest incidence of reported cases. I have excluded China for now since it has been well tracked in the JHU dashboard, and is well into recovery mode.
Looking at the cumulative number of confirmed cases for the top 4 countries (excluding China), we observe a ramp-up in confirmed cases from South Korea around the end of Feb. By March 10, Italy and Iran have overtaken it, and it is currently set to fall below Spain over the next few days. We also see Italy and Iran keeping pace until March 7, at which point the number of cases in Italy takes off.
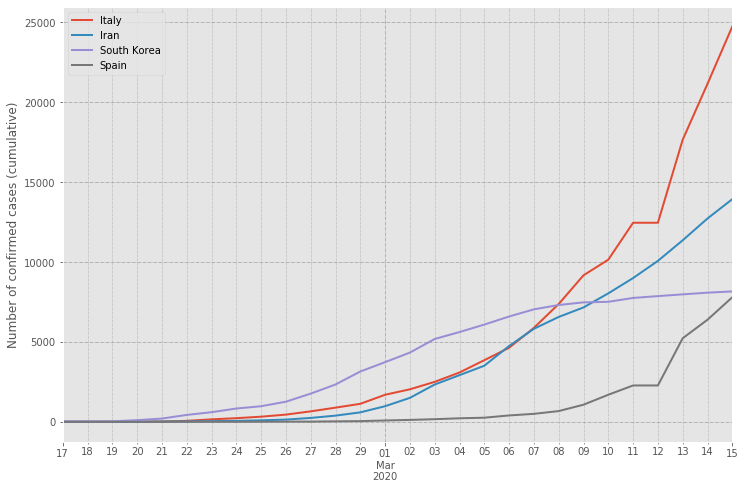
Italy, Iran, and South Korea represent 3 different behaviors in how one might expect cases to grow over time - a ramp up followed by a flattening for South Korea, a more or less linear increase with Iran, and a near exponential growth for Italy.
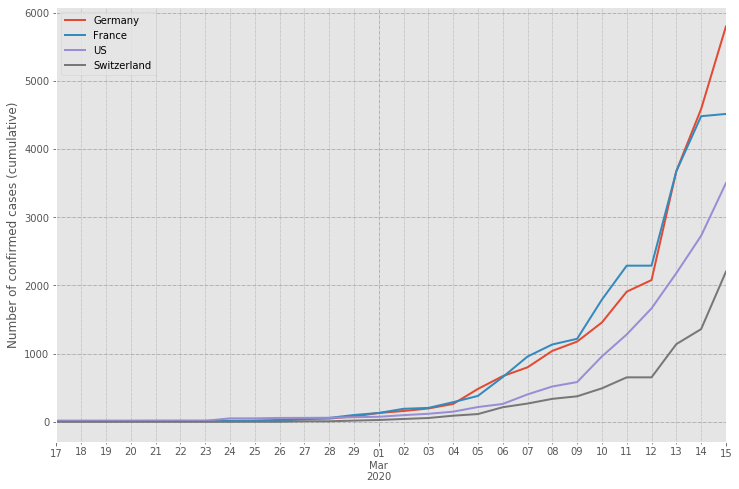
The time series for the next 4 countries by total confirmed cases - Germany, France, the United States, and Switzerland - are shown below. All of these countries have under a 100 cases at the end of February. Starting March 5, we see a growing surge in cases in Germany and France, quite in tandem. The US sees a spurt in cases starting March 9, and in Switzerland starting March 12. The growth in cases has been particularly severe in the European countries starting March 12, and we see that in the prior plot above for Italy and Spain as well. The US by comparison has not seen such a dramtic rise in cases.
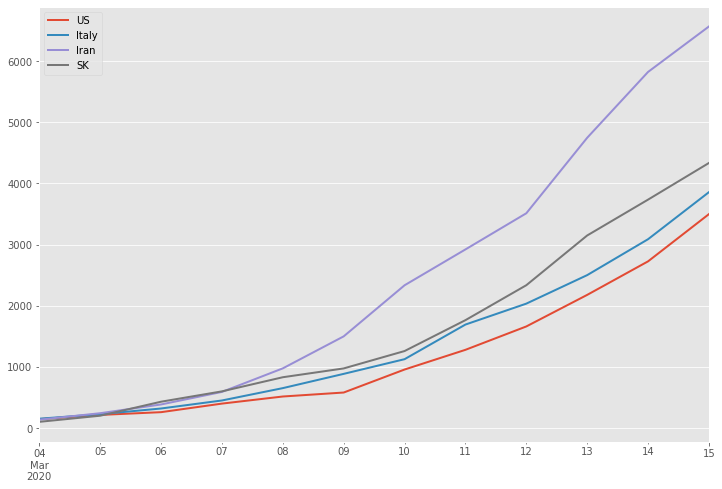
This brings us to the prediction problem - how do we expect cases in the US to grow over the next week? We can predict the number of cases based on the US data available so far. Since it is limited, we will alternately try to use data for each of Italy, Iran, and South Korea by setting them to a common baseline. For example, on March 4, the US had 149 total confirmed cases. Italy had 155 cases on Feb 23, Iran had 139 cases on Feb 26, and South Korea had 104 cases on Feb 20. We can extract the cases for each of these countries starting at the forementioned dates, and align them with the US curve. This allows us to visualize starting from similar number of cases, how the cases have grown in each of the countries
We build 4 different models - 3 of them by adding the cumulative case values for a single country (one of Italy, Iran, and South Korea), and a final one where we add all of the 3 countries. The predictions of the models are shown below. Note that we use data at and prior to March 15 for training the model and predict for the time period from March 16-22, using available values for the regressor countries.
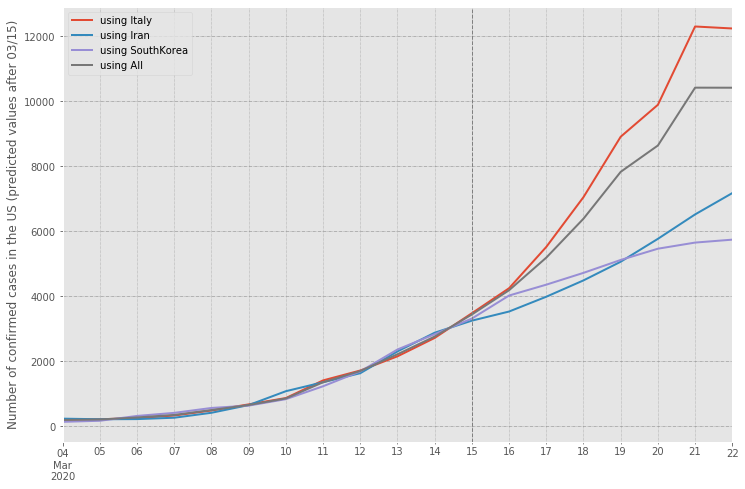
Our lowest prediction comes from using South Korea as a regressor with a predicted range for the US of 5613 to 5867 cases as of March 22. Our highest prediction comes from using Italy as a regressor with a predicted range for the US of 12165-12315 cases. Using all the 3 countries as regressors, the model predicts 10343-10481 cases in the US on March 22. The US currently (as of March 15) stands at 3499 confirmed cases. In percentage terms, the lowest prediction scenario estimates a 63% increase by March 22 relative to the number of cases today, and the highest prediction works out to a 250% increase in confirmed cases by next Sunday, with the full model (with all regressors) resulting in a 197% increase (using the upper bound of the predictions in each of the cases).
Note that the predictions are still quite rudimentary. They do not account for the impact of social distancing, and the expected increase in the number of testing kits in the US which may result in a surge in confirmed cases.
In absolute terms, the difference between the highest and lowest prediction is 6500. At the mortality rate of 5.7%, this is an additional 371 deaths over a week. That is the human cost of both the dynamics of how the virus spreads, and how quickly we can curb it. It is worth erring on the side of caution and following guidelines to keep yourself and others safe.
–